Dependency Graph
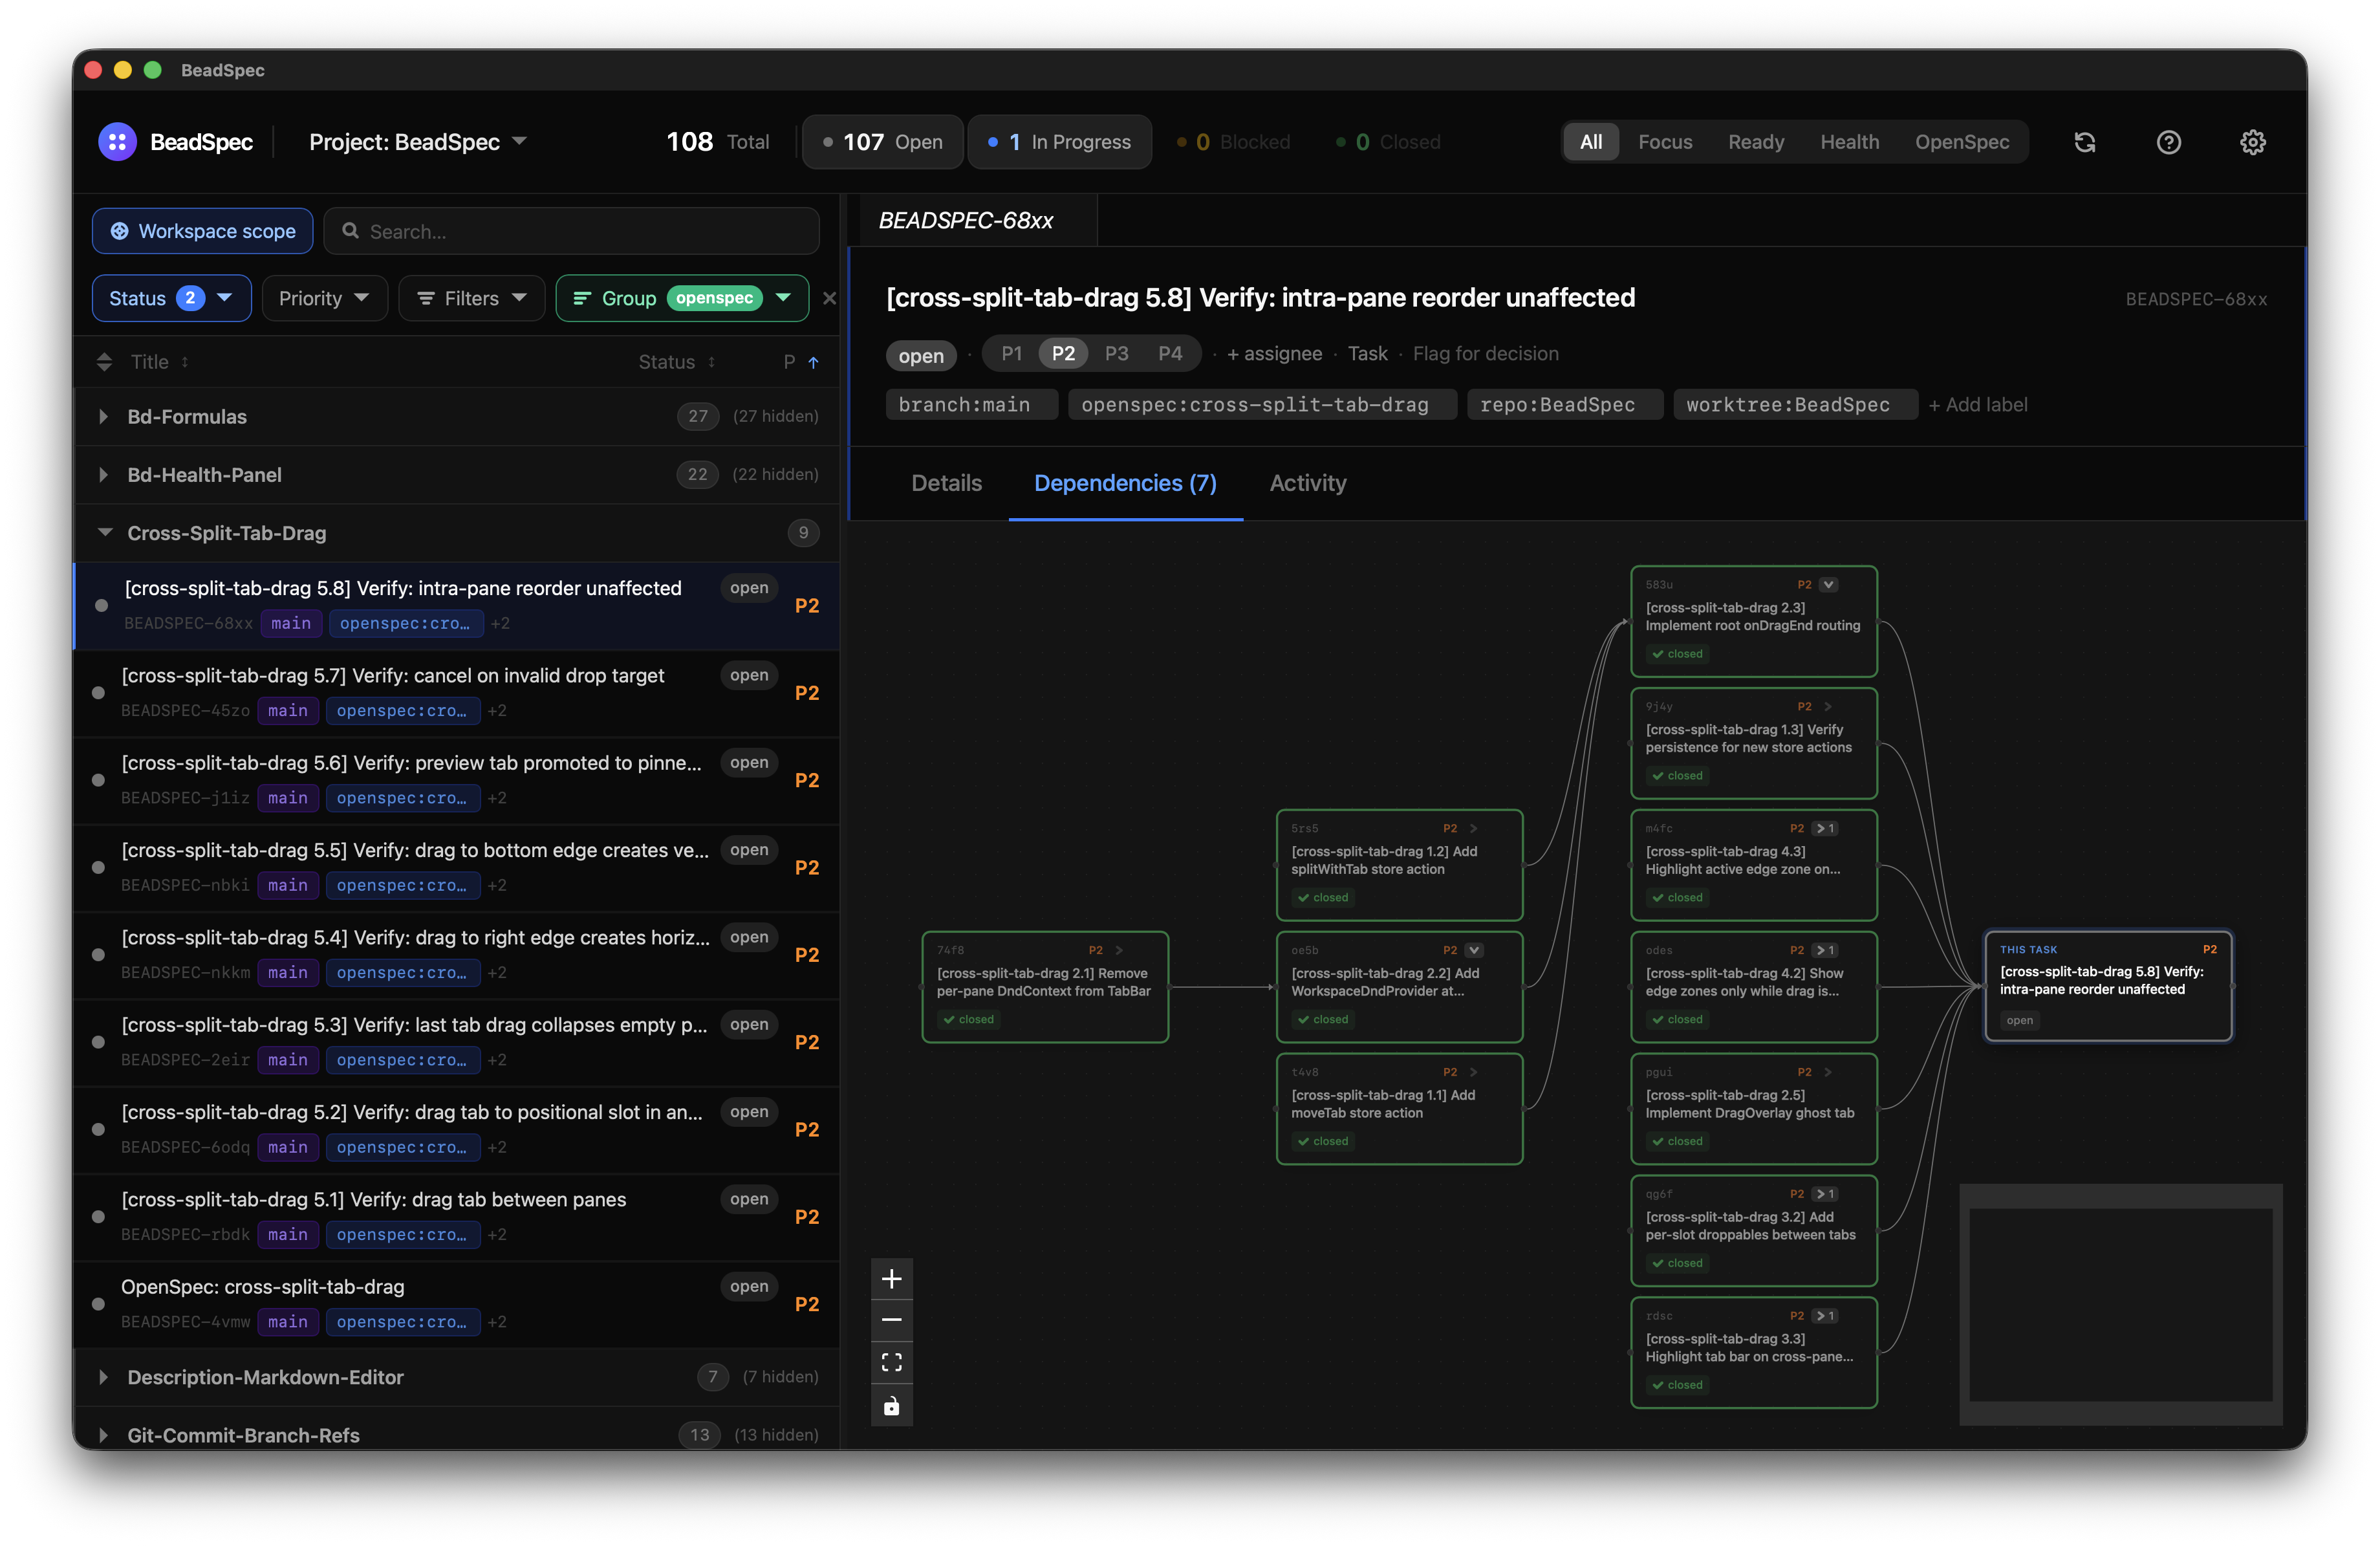
The dependency graph visualizes all issue relationships as an interactive node graph. It uses React Flow for rendering and Cytoscape.js for layout computation.
Opening the graph
Click the Graph tab in the main navigation, or press G from anywhere in the app (when no input is focused).
Interacting with nodes
- Click a node to open that issue's detail panel on the right
- Drag nodes to reposition them (layout resets on reload)
- Scroll to zoom in/out
- Click and drag on the background to pan
- Double-click a node to navigate to that issue in the task list
Reading the graph
- Nodes are colored by status: open (blue), in progress (amber), blocked (red), closed (grey)
- Edges point from dependent → dependency (i.e., an arrow from A to B means "A depends on B" — B must be done first)
- A red node with no outgoing edges that has blocked dependents is a critical path item
Filtering the graph
The filter bar above the graph applies the same filter syntax as the task list. Use it to focus on a subset of issues — for example, status:open to hide closed issues, or label:sprint-1 to see only this sprint's work.
Layout options
Use the Layout button to switch between:
- Dagre (default) — top-down hierarchical layout, ideal for dependency chains
- Cose — force-directed layout, better for dense graphs
- Breadthfirst — left-to-right tree
Limitations
Very large graphs (500+ nodes) may have reduced layout performance. Use filtering to focus on the relevant subset.